Why this evidence matters
Agricultural-drone proposals often begin with the aircraft, camera, altitude, or algorithm. Those choices matter, but they can distract from a more basic question: what physical unit does the ground measurement represent? A model cannot learn a clean relationship between imagery and yield when the image footprint and the harvested reference describe different pieces of the field.
A doctoral study from the University of Palermo offers a useful controlled example. In one 7.6-hectare vineyard, the researchers compared yield measurements assigned to individual vines with measurements assigned to one-metre segments along the row. The UAV, field, crop, acquisition dates, and prediction objective remained within the same research programme. The sampling unit changed, and the model results changed substantially.
This evidence redirects procurement attention from headline sensor specifications toward the chain connecting a pixel, canopy segment, harvested quantity, and training-table row. It does not establish a universal winner. It shows why buyers should demand a declared sampling geometry before accepting an accuracy number.
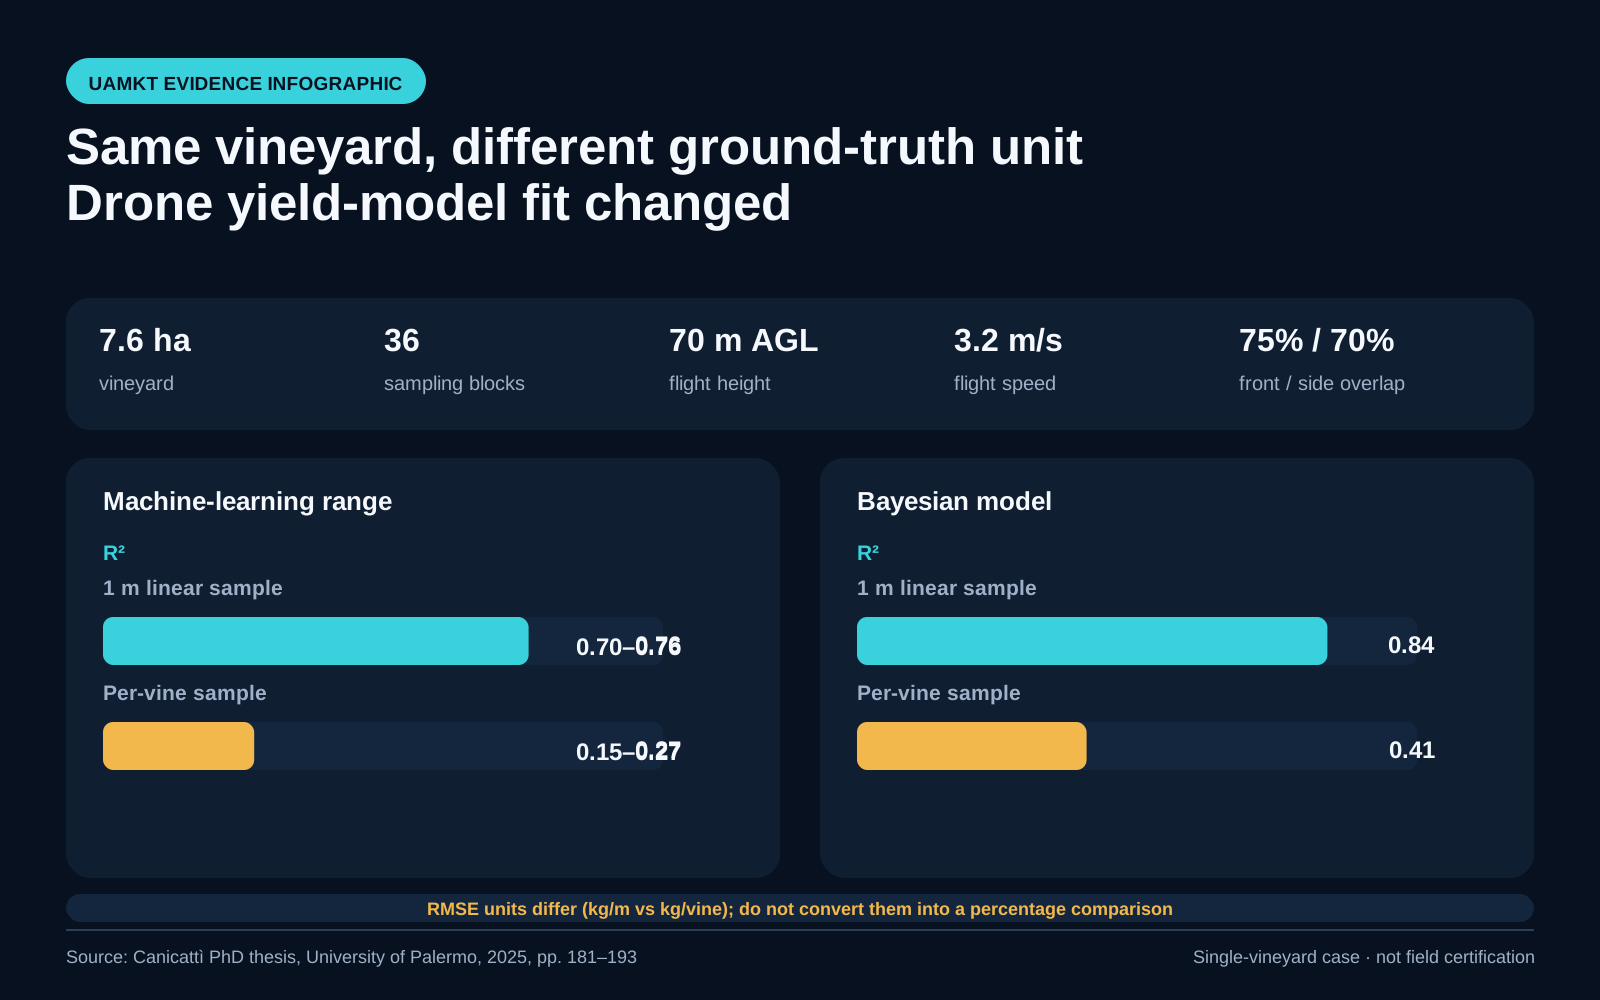
UAMKT editorial infographic based on the cited dissertation. It compares results within one vineyard and does not represent field certification or a universal model benchmark.
What the thesis tested
Marco Canicattì’s doctoral thesis integrated drone remote sensing, machine learning, and Bayesian modelling across several precision-agriculture studies. The comparison used here comes from its vineyard yield-modelling work rather than from the entire thesis as one pooled experiment.
The experimental vineyard covered 7.6 hectares. Researchers divided the field into low-, medium-, and high-vigour zones. Within those zones they formed 36 sampling blocks: three vigour levels, six adjacent blocks, and two field replications. Yield and bunch counts were then organised through two parallel reference systems. One followed individual vines; the other followed one-metre segments along the vine row.
The aerial surveys used a DJI Mavic 3 Multispectral with RGB, green, red, red-edge, and near-infrared sensing. Flights took place on May 23 and August 5, corresponding to BBCH 73 and BBCH 85. The aircraft flew at 70 metres above ground level and 3.2 metres per second, with 75% forward overlap and 70% side overlap. The reported multispectral ground sampling distance was 3.1 centimetres per pixel. Acquisition was conducted around solar noon under clear-sky, low-solar-zenith conditions, and positioning used onboard RTK.
These details matter because the comparison is not simply “AI versus no AI.” It is a comparison inside a defined field workflow: the same vineyard, a specified sensor, two phenological stages, two ground-reference geometries, and several modelling approaches. The key intervention was how yield was spatially assigned.
The numbers to retain
| Evidence item | One-metre row unit | Individual-vine unit | Source location |
|---|---|---|---|
| Sampling design | Yield expressed as kg per metre | Yield expressed as kg per vine | Thesis pp. 181–182, Figure 1 |
| Machine-learning R² range | 0.70–0.76 | 0.15–0.27 | Thesis p. 191, Figure 6 |
| Machine-learning RMSE range | 0.33–0.37 kg/m | 0.62–0.67 kg/vine | Thesis p. 191, Figure 6 |
| Best reported ML pair | Efficient Linear and SVM: R² 0.76, RMSE 0.33, MSE 0.11, MAE 0.28 | Lower and more dispersed performance across the tested algorithms | Thesis p. 191 |
| Bayesian R² | 0.84 | 0.41 | Thesis p. 192, Figure 7 |
| Bayesian RMSE | 0.26 kg/m | 0.55 kg/vine | Thesis p. 192, Figure 7 |
| Bayesian MAE | 0.22 kg/m | Not stated in the comparison text used here | Thesis p. 192 |
The table should be read vertically, within each sampling definition. The RMSE columns have different units and different target constructions. Dividing 0.55 by 0.26 and announcing a percentage improvement would create a false comparison. R² is dimensionless, but it still reflects this field, these target definitions, and this modelling setup.
The stronger meter-based result has a plausible spatial explanation. A vine canopy is not isolated when projected into an orthomosaic. Adjacent canopies overlap, density changes, row geometry introduces displacement, and harvested fruit may not align with one plant polygon. A one-metre segment can align imagery and harvested reference more coherently. That is a mechanism to investigate, not proof that one metre is correct everywhere.
What the study does not prove
The results do not prove that a specific drone brand, multispectral camera, vegetation index, or algorithm will reproduce the same accuracy in another vineyard. They do not compare all possible sampling lengths, training systems, cultivars, climates, slopes, illumination conditions, or harvest methods. The study used one vineyard and two acquisition stages within a particular experimental design.
The results also do not show that remote sensing can replace field measurements. The models depended on measured yield organised into sampling blocks. Nor do they prove a commercial return on investment, automated harvest control, regulatory compliance, or a validated prescription for spraying or fertilisation.
Most importantly, “better R²” does not mean that every operational decision becomes reliable. A model can perform well on an aggregate target while missing edge cases, rare vigour conditions, or year-to-year shifts. Independent-season and external-field validation remain separate gates.
Design and procurement implications
For a grower, service provider, or public buyer, the first requirement should be a spatial data contract. It should state the crop unit, ground-truth collection geometry, coordinate reference, timestamp relationship, aggregation rule, and units before any flight is commissioned. The contract should also identify how partial plants, row ends, missing vines, canopy overlap, and harvest spillover are handled.
Sensor procurement should follow that contract. A smaller ground sampling distance is not automatically more useful when the reference labels are spatially ambiguous. Conversely, a modest sensor may support a useful model when the field unit, image footprint, and operational decision unit are aligned. The buyer should therefore evaluate the complete measurement system rather than ranking bids by megapixels or band count alone.
Model acceptance should preserve the unit in every metric. A dashboard must not display “RMSE 0.26” without kg/m, the sampling geometry, the crop stage, and the validation split. If a supplier changes from per-vine to per-row modelling, that is a model-definition change, not a cosmetic update. Historical performance should not be carried forward without revalidation.
Finally, the decision unit should match the machinery that will act on the result. A variable-rate operation may require row segments, management zones, or implement-width cells rather than plant-level estimates. The most detailed map is not necessarily the most actionable map.
Practical checklist
- Define the operational decision first: scouting, yield estimation, input prescription, or harvest planning.
- Record whether the target is per plant, per metre, per plot, per row, or per hectare.
- Draw the ground-truth polygon or segment before collecting imagery.
- Preserve crop stage, flight time, altitude, speed, overlap, sensor, calibration, and positioning metadata.
- Keep training, internal validation, independent-season validation, and external-field validation separate.
- Report R² with RMSE or MAE and retain the physical unit beside every error value.
- Do not calculate a percentage improvement between RMSE values expressed in kg/m and kg/vine.
- Inspect alignment errors at row boundaries, missing plants, overlapping canopies, and partial harvest units.
- Require a change log when the sampling geometry, aggregation rule, or target definition changes.
- Treat transfer to another farm, cultivar, year, or sensor as a new validation question.
Source and scope note
Primary source: Marco Canicattì, Integrating Drone-Based Remote Sensing, Machine Learning and Bayesian Modeling to Advance Precision Agriculture, PhD thesis, University of Palermo, cover year 2025; institutional deposit published in 2026. See the University of Palermo record, the official thesis PDF, and the exact-title Google Scholar search.
The field design and flight conditions above come from pp. 179–182. Model comparisons come from pp. 191–192 and Figures 6–7. All numerical statements are paraphrased from the institutional thesis. This field note does not claim that the results have been reproduced by UAM KoreaTech or that they establish performance outside the reported vineyard experiment.