Why this result matters
Collision-avoidance claims often lose their test boundaries as they travel from a thesis into a slide, procurement note, or product page. A result obtained with a particular algorithm, traffic count, field size, and simulation setup can quickly become a broad statement about “airspace capacity.” That translation is unsafe. It hides the conditions that produced the result and makes unlike systems appear directly comparable.
David Jones’s 2015 Auburn University master’s thesis offers a useful case because it compares two reactive collision-avoidance approaches in a common ROS-based research environment. The approaches are artificial potential fields (APF) and inverse proportional navigation (IPN). The repository abstract reports the largest tested aircraft counts each approach handled safely in two square simulated fields. Those values are informative when kept inside their original frame.
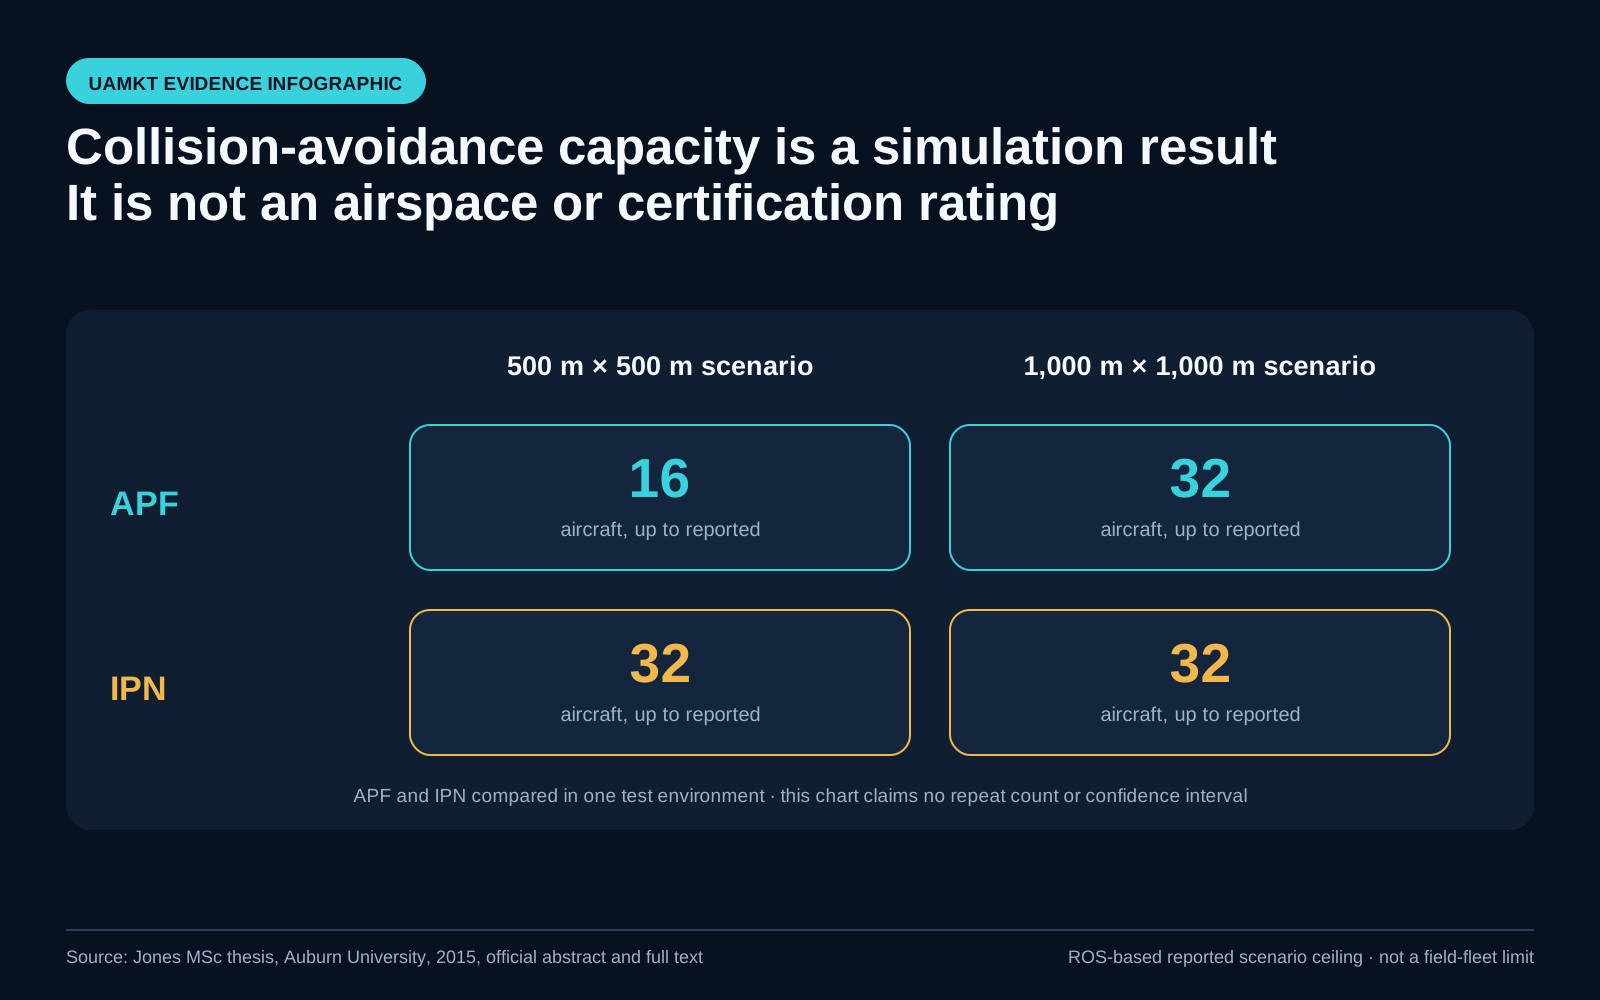
Editorial infographic. The values describe reported scenario limits in one thesis; they are not certified airspace capacity, operational approval, or field validation.
Read the simulation conditions before the numbers
The thesis uses a base-station system built on the Robot Operating System to evaluate autonomous aircraft behavior in both simulated and research environments. For the comparison summarized here, the important variables are the dimensions of the square test field and the number of UAVs present at the start of a run. Safety and efficiency are the evaluation themes. The two algorithms also act differently: APF builds motion from attractive and repulsive forces, while IPN uses navigation relationships to generate avoidance behavior.
That shared environment is valuable because it reduces one common comparison error: placing results from unrelated platforms, sensor suites, traffic geometries, and success definitions beside each other. It does not remove every confounder. The public repository abstract does not provide a denominator of repeated runs, uncertainty intervals, weather effects, communications impairments, sensor-error distributions, or a representative operational traffic mix. A procurement reader therefore has enough evidence to discuss the reported scenario envelope, but not enough to calculate a general failure probability.
The dimensions also need precise wording. “500-meter square field” is treated here as a 500 m by 500 m test field, and “1,000-meter square field” as 1,000 m by 1,000 m. It should not be rewritten as 500 square metres or 1,000 square metres.
The reported 2 × 2 result
| Reactive method | 500 m × 500 m field | 1,000 m × 1,000 m field |
|---|---|---|
| Artificial potential fields (APF) | Handled up to 16 aircraft | Handled up to 32 aircraft |
| Inverse proportional navigation (IPN) | Handled up to 32 aircraft | Handled up to 32 aircraft |
“Handled up to” is deliberate. It means the thesis reports that the method handled that aircraft count under its tested scenarios. It does not establish the algorithm’s universal maximum, the safe density of a real operating area, or the number of aircraft a regulator should authorize. It also does not show that every lower traffic count will succeed under every geometry or disturbance.
The most decision-useful contrast is the congested-field case. In the smaller field, the reported APF limit is 16 aircraft while the IPN result reaches 32. In the larger field, both reach 32 in the reported comparison. This pattern supports a narrow engineering question: when screening candidate algorithms for a defined simulation campaign, congestion and field size should be explicit test factors rather than background details.
What the thesis does not prove
The result is not evidence that IPN doubles real-world airspace capacity. Capacity depends on separation standards, mission geometry, aircraft performance, surveillance quality, communications, contingency behavior, human oversight, weather, and applicable authorization. None of those can be collapsed into a single aircraft-count cell.
It is not certification evidence. A university simulation does not establish compliance with a detect-and-avoid standard, an airworthiness basis, a BVLOS approval, or a UTM service requirement. It is not a flight demonstration of 32 operational aircraft in public airspace. It is also not a measured accident-rate reduction.
Finally, the repository’s positive wording about handling the scenarios must not be restated as a 100% success rate. A percentage needs a disclosed denominator, repeated-trial design, failure definition, and uncertainty treatment. Those elements are not established by the four headline values. The safe editorial form is “the thesis reports handling up to,” followed immediately by the test-field size and algorithm.
Implications for testing and procurement
For an engineering team, the table is a starting point for a test matrix, not a product ranking. Recreate the traffic geometries, define loss of separation before running the test, and vary more than aircraft count. Relative heading, starting distance, speed, maneuver authority, latency, localization error, dropped messages, boundary behavior, and recovery logic can all change the outcome. Include adversarial arrangements and record near misses, not only collisions.
For procurement, ask each supplier to provide a traceable claim statement. It should identify software and parameter versions, vehicle dynamics, sensing assumptions, field geometry, traffic generator, minimum-separation threshold, run count, exclusions, and raw or reviewable evidence. If two suppliers use different success definitions, normalize the protocol before comparing their headline numbers.
The result also shows why a single “maximum UAV count” requirement is weak. A better requirement describes an operational design domain and a verification method. For example, the buyer might define a traffic-density range, encounter classes, navigation uncertainty, communications delay, minimum separation, and a required number of independent runs. The acceptance record can then distinguish observed performance from approved operational limits.
Review checklist
- Is the claim tied to an exact algorithm and software baseline?
- Are field dimensions written as length by width, not mistaken for area?
- Is aircraft count separated from aircraft density and encounter geometry?
- Is “handled up to” preserved instead of converted into capacity or certification language?
- Are the run count, failure definition, minimum separation, and uncertainty reported?
- Were sensor error, latency, communications loss, and boundary effects tested?
- Does the evidence include near misses and recovery behavior as well as collisions?
- Are simulation, hardware-in-the-loop, controlled flight, and operational deployment labeled separately?
- Is supplier evidence reproducible under a buyer-controlled acceptance protocol?
- Does the final decision remain with the responsible operator, authority, and assurance process?
The useful lesson is not that one algorithm “wins.” It is that collision-avoidance numbers become decision-grade only when the scenario travels with the number. A four-cell comparison can sharpen a test plan, but it cannot substitute for an operational safety case.
Sources and scope
- Auburn University official thesis record
- Auburn University thesis PDF
- Google Scholar exact-title search
This field note paraphrases the university record and does not reproduce thesis text. It is an educational interpretation of a bounded research result, not aviation, certification, procurement, or legal advice.